codemode-lab
MCP cost tools audit the tool definitions. That is the small number. What one tool call gives back is the number that decides whether your task runs at all, and code mode benchmarks do not measure it as its own term.
- Role
- Author & Maintainer
- Year
- 2026
Problem
The best-known numbers for MCP "code mode" are illustrations or counts of tool definitions, compared against a baseline nobody would ship. The careful studies measure definitions and the number of calls, not the size of what one call returns.
Solution
Five questions, each asked twice: once by an agent calling tools directly, once by an agent writing a program. Every prediction was written down before the run, and two of the five say code mode should lose.
Outcome
Five runs per arm on claude-sonnet-5. When the direct arm had to read a large result, it cost 12 to 63 times as much as code mode at list price and answered correctly less often. Where the data fits, the two arms came out close, and one task called as a code mode loss was a clear win. Two of four directional predictions held on prompt tokens.
An agent has a desk, and the desk is small
An agent has a finite memory. Every tool result lands in that memory and stays there.
Picture an assistant at a desk. You ask which of five thick manuals mentions a thing.
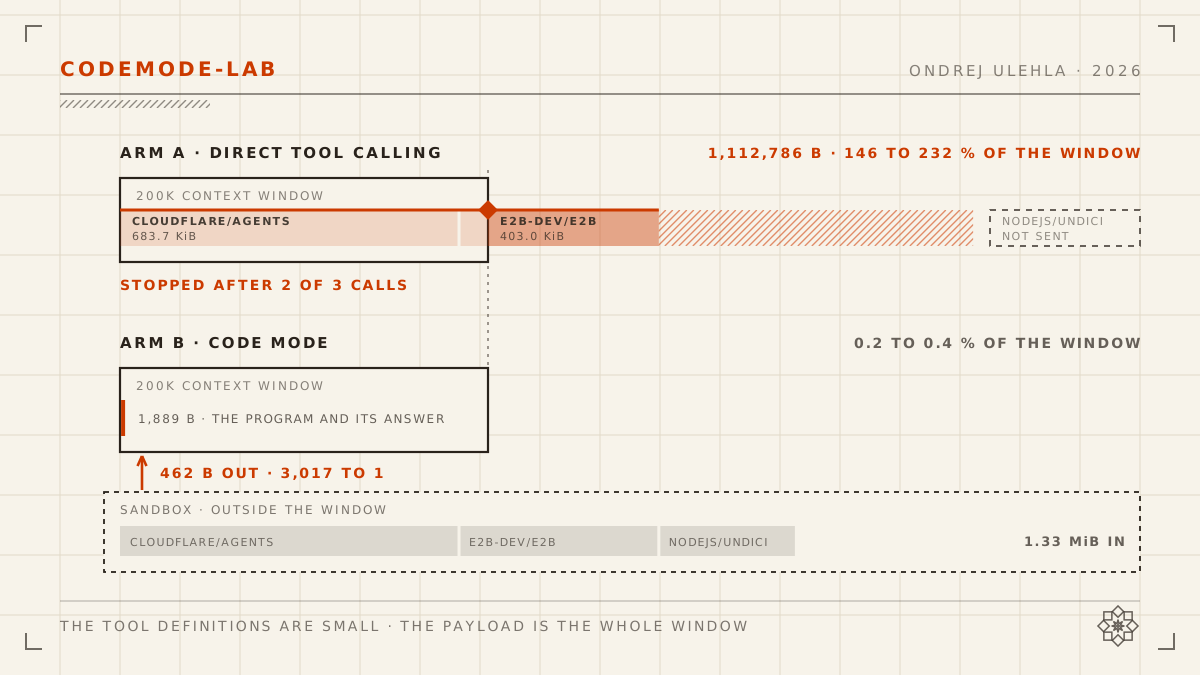
Way A photocopies all five manuals and piles the copies on the desk. The desk overflows after the second manual. The assistant never finishes, and the work they did do is buried.
Way B sends a note to the archive. Go through these five, count the mentions, come back with one sheet. The desk only ever holds one sheet.
The desk is the context window. The photocopies are tool results. Way B is code mode: the agent writes a small program that calls its tools, the program runs in a sandbox, and only what it returns reaches the model.
The headline numbers for way B are striking. Anthropic’s write-up shows 150,000 tokens falling to 2,000. Cloudflare reports 99.9 percent. Both are honest about what they are, if you read closely: the first is a worked example of a hypothetical task, and the second measures the size of a tool definition blob across 2,500 endpoints. Neither counts the tokens a task consumed.
So I measured it.
Most numbers measure the catalogue card
Before an agent calls anything it reads a card that lists which tools exist. That card is what most published cost comparisons measure. It is the tool definition tax. It is a real number, and it is easy to measure.
It is also the small one. Three public MCP servers expose 8 tools between them, and their whole definition surface is 11,268 bytes. About 3,000 to 4,700 tokens. That is 1.5 to 2.3 percent of a 200K window.
Then I called one of those tools.
| repo | text returned | of a 200K window |
|---|---|---|
| apify/apify-mcp-server | 728.2 KiB | 98 to 155% |
| vercel/ai | 712.8 KiB | 96 to 152% |
| cloudflare/agents | 683.7 KiB | 92 to 146% |
| nodejs/undici | 274.4 KiB | 37 to 59% |
The byte counts are exact, measured on 21 September 2026. A KiB is 1,024 bytes. The right-hand column is not exact: this case study counts bytes and ships no tokenizer, so it estimates tokens at 2.4 to 3.8 bytes per token and prints every such figure as a band.
The high end of the band comes from a billed count. In the sweep further down, one result of 392,601 bytes grew the prompt of claude-sonnet-5 by 163,895 tokens, the median of five runs: 2.4 bytes per token. claude-opus-5 read it the same way. The band used to end at 3.3, and every share of the window on this page was lower than it is now.
Take the third row. 683.7 KiB is 700,150 bytes, and that is one call to one tool.
the cardDeepWiki · 3 tools
1,526 Ball three cards8 tools · three servers
11,268 Bone manualone call · one tool
700,150 B
The manual is 459 times its own card, and 62 times all three cards together. On this scale the card is two pixels wide, and that is the honest width.
A ratio with no denominator is how this kind of claim goes wrong, including for people who are not trying to mislead anybody. That is why both denominators are named above.
The result size is not unknown. Anthropic’s own post describes results passing through the context, and one benchmark counts how often a result is too long. What I did not find is a code mode benchmark that measures it as its own term, call by call. The card is the small number.
The recorded run
The same three calls, made twice against the live DeepWiki server, once, on a laptop. No model ran in this recording. Arm A shows what a client that keeps every result would have to hold. Arm B is the real program in a sandbox. The results further down are the run with a model in it.
arm a · directevery result stays in the window
0 Bemptystopped
arm b · code modeonly the answer enters the window
0 Bempty
in the sandbox, outside the window: 0 B
arm a · direct tool calling, simulated
No model ran. These are the calls a client would make, one after the other, and every result stays in its window. Claude Code does not keep them: it writes a result over 25,000 tokens to a file.
context window · every result stays
- cloudflare/agents
waiting
- e2b-dev/E2B
waiting
- nodejs/undici
waiting
stopped at 70.8 s
The results already in the window pass 200,000 tokens at the most generous rate this page uses. The remaining calls are not sent.
arm b · code mode
The program asks for all three at once. The results land inside a sandbox, the program reads them there, and one small answer crosses out to the model.
sandbox · results stay inside
- cloudflare/agents
waiting
- e2b-dev/E2B
waiting
- nodejs/undici
waiting
the question, and the program arm B wrote
DeepWiki returns each repository's documentation as one markdown dump. The dump is a series of pages. Every page starts with a line of the form '# Page: <title>'. Count a table row as any line that starts with the pipe character. For cloudflare/agents, e2b-dev/E2B and nodejs/undici, find the page that holds the most table rows. Give the exact page title for each repo, copied character for character, and copy the first table line of that page as evidence.
// Three dumps, 1.39 MB in, about 300 bytes out.
//
// The three payloads are fetched concurrently and scanned inside the sandbox. None
// of them ever reaches the model.
const repos = ['cloudflare/agents', 'e2b-dev/E2B', 'nodejs/undici']

const results = await Promise.all(
  repos.map(async (repo) => {
    const dump = await deepwiki.read_wiki_contents({ repoName: repo })
    const pages = dump.split(/^# Page: /m).slice(1)
    let best = null

    for (const page of pages) {
      const title = page.split('\n', 1)[0].trim()
      const lines = page.split('\n')
      const rows = lines.filter((l) => l.startsWith('|'))
      if (!best || rows.length > best.rows) {
        best = { title, rows: rows.length, evidence: rows[0] ?? null }
      }
    }

    console.log(`${repo}: ${dump.length} chars, ${pages.length} pages, top page ${best.rows} rows`)
    return { repo, ...best }
  }),
)

return results
What a real agent did
Five questions, each asked twice. Once by an agent calling the tools directly, once by an agent writing a program that calls them inside a sandbox. Same model, same question, the same tools allowed. Each approach ran as two arms, one with the prompt cache and one without, and every arm ran five times.
I wrote the prediction for each one down before the run, and two of the five say code mode should lose. A comparison with no losing case is marketing.
The harness runs those five tasks through the Claude Agent SDK, on claude-sonnet-5 at low effort, and reads the tokens off the API response. Those figures are billed, not estimated.
On the two large tasks there is a catch. Claude Code writes any tool result over 25,000 tokens to a file, and the plain direct arm has no tool that can open one, so it never sees the data. A normal session could open that file, so a third arm does: it keeps Read and Grep and reads the file in parts.
| task | read, then returned | code mode | direct | direct, reads the file |
|---|---|---|---|---|
| table-heavy-pageWhich page of each dump holds the most table rows?called for code mode · held | 1.33 MiB then 1.4 KiB | right 10 of 10 | never saw the data | right 2 of 563x the cost |
| one-big-payloadWhich page of one large dump holds the most code blocks?called for code mode · held | 383.4 KiB then 451 B | right 10 of 10 | never saw the data | right 3 of 512x the cost |
| structure-rankRank four repositories by the size of their topic outlinecalled for direct · did not hold | 4.4 KiB then 102 B | right 10 of 10 | right 10 of 103x the cost | not run |
| outline-leavesWhich outline entries have no sub-entries?called for direct · tie | 1.0 KiB then 1.0 KiB | right 10 of 10 | right 10 of 10about the same cost | not run |
| topic-overlapWhich documentation topics do several of these repositories share?no call made | 9.0 KiB then 9.8 KiB | right 10 of 10 | right 9 of 10about the same cost | not run |
what the harness says about its own limits
- Every token figure here is what the Anthropic API counted, read from modelUsage on the final result message.
- Per-turn figures are read from each API response and cover the input side only.
- Both arms declare the same tools: the direct arms have every other tool of the server removed.
- Claude Code writes an MCP result over 25,000 tokens to a file. A-uncached and A-cached have no tool to read it; A-files does; A-raw raises the limit.
- The Node worker used by arm B is an isolation boundary for measurement, not a security boundary.
- No dollar figure here is billed. Costs derived from these tokens use list prices and say so.
Code mode wins when its program returns much less than it reads. On the two large tasks it read up to 1.33 MiB and returned under 2 KiB. On outline-leaves and topic-overlap it returned about as much as it read, and the two arms came out even.
Where the data fits, the two arms are close. On outline-leaves the two prompts are within 1 percent of each other. On topic-overlap they are within 3 percent, and code mode answered correctly in all ten of its runs, the direct arm in nine.
One predicted loss was a clear win. structure-rank was called for direct. Code mode used 35 percent fewer prompt tokens and cost 31 percent of the direct arm’s list price. The direct arm read four outlines into its window and wrote about three times as many output tokens, 854 against 293. The program counted the entries in the sandbox and returned 102 bytes. So two of four directional predictions held on prompt tokens, and the miss on structure-rank is not noise.
Reading the file works, and it costs. The third arm reads the file in parts, and every part stays in the prompt of every later turn. On table-heavy-page that came to 1.7 million prompt tokens in the median run, and it ran out of turns, at 40, in three runs of five. A fourth arm raises the limit, so the whole result lands in its window: 168,548 prompt tokens for one question, about 28 times the cost of code mode. Code mode answered both tasks correctly in all 20 of its runs, with prompts near 5,500 tokens.
The first sweep found the direct arm wrong on topic-overlap, with every result in its window. On claude-sonnet-5 it was right in nine runs of ten. A smaller check on claude-opus-5, with the same harness and two runs per arm, found it wrong in all four runs and code mode right in all four. So that finding holds for one model and not for the other.
How I know I am not fooling myself
The first measurement was wrong four ways. Reading the transcripts is what found all four. Each one would have produced a number, and every one of those numbers would have been wrong.
- The model already knew the answer. The question asked whether some repositories document a WebSocket API. The model could answer correctly having called no tool at all. The benchmark measured recall, not data access.
- The answer was inside the question. The strings the grader looked for appeared in the question itself. Restating the question passed the grade.
- The two arms had different tools. The direct arm loaded three tools. Code mode got one. The first fix let both arms call only the same tool, but the direct arm still carried the two other definitions in its context. Now they are removed.
- A permission setting bypassed a ban. One tool was banned so the run would not spend a provider’s money. A permission setting silently overrode the ban, and the tool was called anyway.
Every replacement question is now graded on a string the documentation generator invented, not on anything the repository says. Each string is checked to return zero hits inside its own repository. A test fails the build if a grading string ever appears in its own question again.
A second review, a day later, found nine more faults. The ones a reader of this page should know:
- The number I published as the tool tax was not the tool definitions. It was every input token over a tool-less baseline across every turn, tool results included. The definitions are now counted on the first request only, where they are the only difference.
- The cached code mode arm counted the uncached arm’s calls too. One counter was reset once per task instead of once per arm.
- The typed surface told the model the wrong return type. It promised an object and the sandbox delivered a string. A test now type-checks every reference program against the surface the model reads.
- The daily check that re-measures every claim went green while it failed. A pipe swallowed its exit code, and it stayed green through two stale claims.
- Only one arm got the server’s instructions. Claude Code hands a server’s instructions to the direct arm, about 3 KB for DeepWiki, and nothing handed them to code mode. Every code mode request started lighter for a reason that had nothing to do with code mode. Both arms get them now.
- The page said “no answer” where the direct arm had answered wrongly. The results table now tells the two apart.
The sweep itself found three more:
- An arm set to run without the prompt cache used it anyway. It happened in 35 of 55 runs. The harness now flags such a run and keeps it, and the summary counts the whole prompt, cache reads included. A run like that costs less at list price than a truly uncached one, so the uncached price ratios are the noisier ones.
- Raising the output limit did not put the result in the window. Claude Code has a second limit that writes a large result to disk, and only the tool itself can raise it. The arm with the raised limit now calls the live server through a small proxy that declares that limit.
- An arm that ran out of turns lost its whole record. The SDK throws after its last message, and the harness dropped the run with its tokens. It now keeps the run and counts it as not completed.
A ratio is only honest when both arms answer the same question. One of my losing tasks reported a 17x saving. The program was returning a 300 character excerpt of a document the task had asked for in full. Returning the whole document scored 1x. The second number is the true one, and the first is how a volume comparison gets gamed.
One number needs one definition. I recorded the definition size as wire bytes for one server
and as JSON length for another, and the daily liveness probe then reported a 75 percent drift that
had not happened. It was comparing a handshake reply against a tool list. The repo now measures
JSON.stringify({ tools }) everywhere, whatever transport the server speaks.
One label needs one unit. “kB” meant 1,024 bytes in one place and 1,000 in another, so one payload appeared at two sizes, and once a KiB figure was written as bytes. Sizes are now printed in KiB and MiB.
The caveat, not buried
The first sweep ran every arm with no file tools, and a normal session keeps them. That caveat now has an answer. The arm that reads the file is that session. On the two large tasks it cost 12 and 63 times as much as code mode and was right less often.
The narrow claim stands. A payload that does not fit has to be processed outside the context window. Code mode is one way to do that, and a file with a search tool is another. On these two tasks the file was the expensive way.
What remains is the model. The check on claude-opus-5 agrees on cost. Code mode used 36 percent fewer prompt tokens on structure-rank there too, and outline-leaves was a tie again. On one-big-payload, the only large task it ran the two arms that reach the data on, both answered correctly and cost 9 and 27 times as much as code mode. So the narrow loss on the first sweep came from the harness it ran on, which has been fixed since, not from the model. Where the two models differ is accuracy, on topic-overlap. Both ran at low effort.
What others found
- Anthropic’s own documentation reports a case where the pattern loses: on τ²-bench, scores did not change and cost rose about 8 percent.
- A study of 425 runs on GitHub tasks put code mode at 84 percent success, 0.101 dollars a task, and the slowest of five approaches. A plain command line tool reached 86 percent at 0.054 dollars.
- A study of 14 models found that programmatic tool calling costs more tokens below about 26 parallel calls. Its tools returned nothing, so it measured the number of calls, not the size of a result.
- A test with 50 runs a task cut input tokens by 78.5 percent, mostly tool definitions, and raised output tokens by 120 percent.
The sources, and what each one measured, are in the repository’s prior art notes.
What comes next
One open question: where is the break-even point? At what result size, with and without caching, does code mode start to pay? One study found a break-even for the number of calls. I found none for the size of a result, and that is the number this project is built to measure. The harness now has a synthetic server that returns a result of a size it is given, so the next run can look for it.