agent-lens
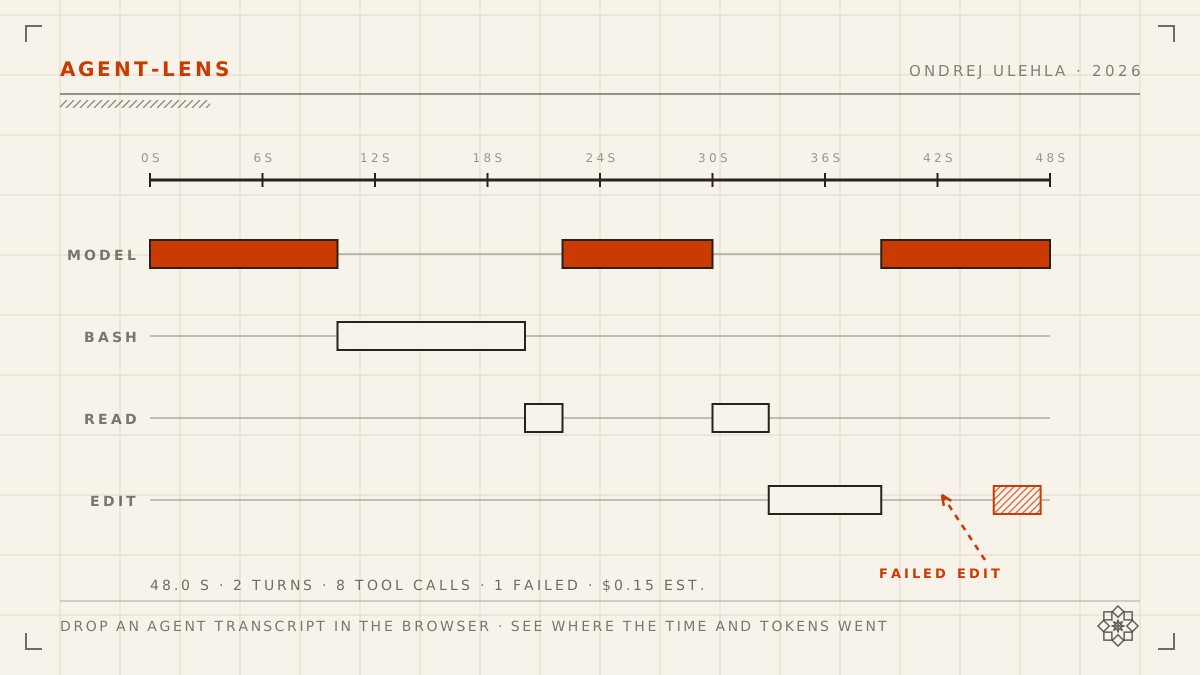
Drop an AI agent session transcript into the browser and see what actually happened – tool-call timeline, where the time went, tokens, cost and failures. 100% client-side.
- Role
- Author & Maintainer
- Year
- 2026
Problem
Agent sessions are long, branching and expensive – and the evidence of what went slow, wasteful or wrong is buried in hundreds of lines of raw JSONL nobody reads.
Solution
A client-side visualizer with a tolerant JSONL parser: it pairs tool calls with their results to measure real durations, and renders the session as a scannable timeline with stats.
Outcome
A 40-second glance replaces reading 400 lines of JSON – and because transcripts contain code and secrets, nothing ever leaves the machine.
Context
I build and debug AI agents daily. The single most useful debugging artifact – the session transcript – is also the least readable one: a JSONL wall where tool calls, their results, token accounting and failures interleave across hundreds of lines. Answering simple questions like “which tool ate the time?” or “where did it fail first?” meant scrolling and grepping.
Problem
Existing observability platforms want your traces uploaded to their cloud. But agent transcripts routinely contain proprietary code, file paths and credentials – exactly the data you don’t want to ship anywhere just to look at a timeline.
Solution
A fully client-side React app:
- Tolerant parser – Claude Code session files first-class, generic
{role, content}dumps too; garbage lines are skipped and reported, timestamps are optional. Tool calls are paired with their results by id, so durations are measured, not guessed - Session timeline – every event positioned in real session time, colored per tool (validated colorblind-safe palette), failed calls ringed in red, hover for details
- Where the time went – per-tool wall-clock totals, call counts, failure counts
- Stat tiles – duration, turns, tokens in/out and estimated cost derived from the model named in the transcript
- Event inspector – the full sequence, expandable, tool inputs paired with results
Outcome
- Sessions become scannable: the slow tool, the first failure and the retry loop are visible in seconds
- Zero-upload privacy by construction – there is no backend to leak to
- The parser is covered by a dedicated test suite (malformed lines, dangling tool calls, missing timestamps, generic formats)
What I learned
Designing for hostile input was the real work – a debugging tool that crashes on the exact malformed transcript you’re debugging is worse than useless, so every parser path assumes the data is broken until proven otherwise.